
6 Surprising Ways Data Visualization Can Streamline Your Business
Streamlining your business has a lot to do with understanding dynamics between all the variables that impact the business and acting on information at the right time. The success of every business is directly correlated to accurate decision making, and accurate decision making comes out of having all necessary information at your fingertips.
Decision makers across businesses struggle with making sense out of vast amount of data available to them to find what is relevant. Business data visualization can come to the rescue when faced with such a problem. It can de-clutter volumes of data and tables, and bring clarity on the relevant parameters. Here are some surprising ways in which data visualization can streamline your business.
Generally, the human brain grasps pictorial or visual representations 90% faster than text or tables. Data visualization enabled decision makers to draw insights, enables the brain to process information faster and allows for quicker decision making.
Visual or pictorial data helps the brain to think. It processes visual data quickly and focuses on thinking of possible options/alternatives to the current state. Time is spent on solving the problem at hand rather than figuring out what the data means.
It becomes easier to draw insights or foresee emerging trends through data visualisation. Our minds can easily extrapolate what they see as trends or insights to predict the future.
Data visualizations help in uncovering hidden variables. We are able to see connections between incidents or actions that normally would not seem correlated.
Data visualizations allows for comparison with historic data or benchmarks at a glance. This helps in the big picture thinking and on focusing on parameters that matter the most.
Visualization makes it easier to identify what’s going right and what’s going wrong. Businesses and decision makers like to focus their time of learning from what’s going right and fixing what’s going wrong. Data visualization allows users to cut through the clutter and focus on what’s important.
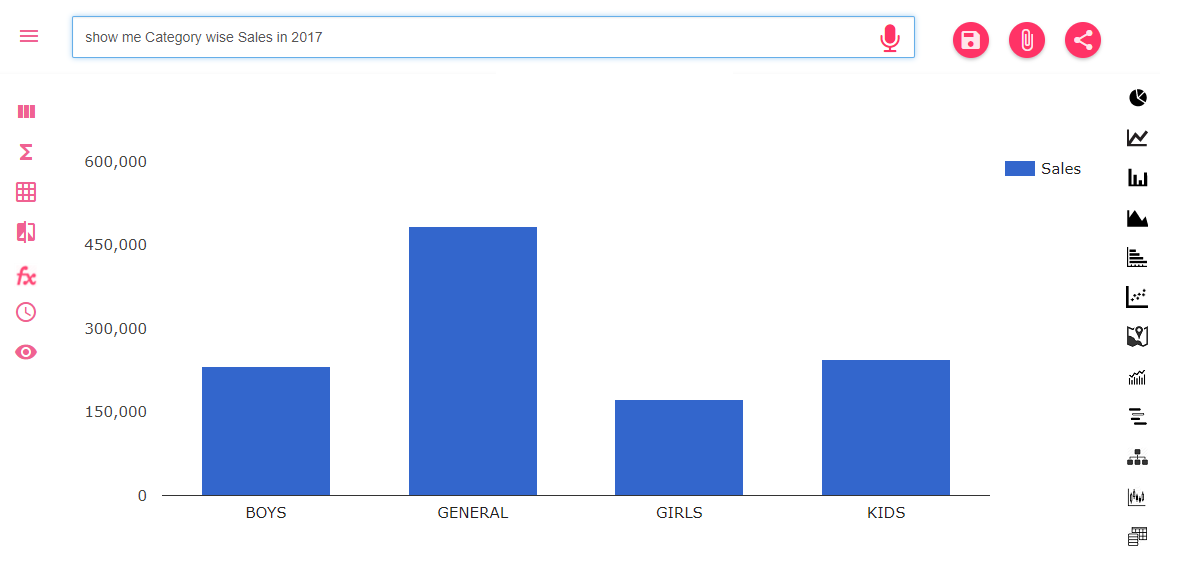
Data visualization and analytics tools help businesses and decision makers in accessing relevant information about their business instantly on their desktop or smartphone. This allows users to access real time information and act when required. Further, search based analytics tools are able to answer questions that a user asks in a graphical manner aiding decision making.
So, if you believe that your business can be streamlined, made more productive and profitable, start with using a data visualization and analytics tool. It will help in understanding your business better, drawing insights about your market and taking decisions at the right time.
Dashboard To Improve Your Business
Get your search results quickly for the selected data with our instant search option.